GROUP HEALTH RESEARCH INSTITUTE
I worked on this project between January and June of 2013, along with my MSIM classmate, Karmin Mauritz. It was our master's degree capstone project, and it represents the culmination of our work at the University of Washington's Information School. We worked with Greg Simon, a senior investigator at the Group Health Research Institute.
Group Health Research Institute and the Mental Health Research Network
The Mental Health Research Network is a collaboration of 11 HMOs that have agreed to share information for research. They have a lot of data, but it currently requires significant technical training to use. This limits its ability to improve healthcare by preventing a wider audience - including clinicians, researchers, and policy makers - from using the data to make informed decisions. We worked with the Group Health Research Institute to design a tool that will make it easier for more people to use the data.
Design problem
We uncovered several requirements and design challenges as we completed our project. The primary requirements and challenges were:
-
How do we display “rate” in a clear, meaningful way?
-
How do we show statistical significance, especially for users who may not have a strong understanding of the term?
-
Make sure that the user understands the question she’s asking
-
Make sure that the data is sufficiently de-identified to prevent privacy concerns
-
Sites are reluctant to share data and don’t want to “look bad”
-
Who are our users? Most of our user base does not yet exist; they aren’t aware that the data even exists!
What we did
We followed an iterative design process, including research, data analysis, sketching, wireframes, prototypes, and usability tests. We interviewed researchers and clinicians, talked to data analysts, and tested our design ideas with potential users - iterating after each session to improve the overall design.
Research
We conducted seven interviews with different users and potential users of the tool to help us understand the user needs and project requirements. We also completed extensive data analysis on the data set we were given in order to understand the particular make-up of the data and how the data would affect our final design recommendation.
Sketching and ideation
I sketched throughout the project. Here are a couple of examples:
Wireframes
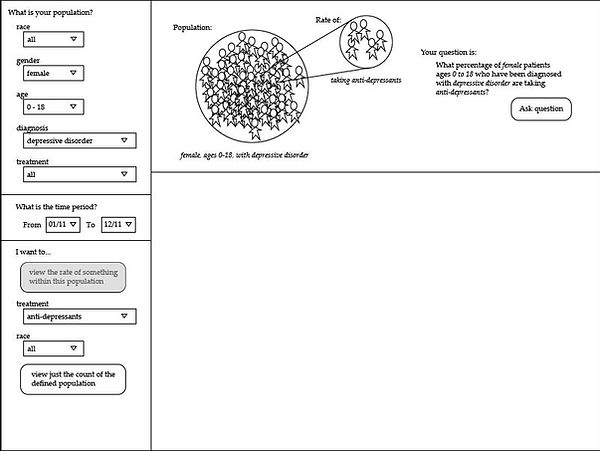
I created several early wireframes that are higher-fidelity versions of some of my early ideation surrounding the "ask question" interface. These wireframes are a far cry from the final design, but their creation helped me refine my ideas about how the interface should look and act.
Some wireframes showing a "walkthrough" process for asking a question:
A wireframe showing an early version of the population circle we use in the final design:
Usability testing
All told, we completed nine usability tests. Early tests were done using paper prototypes, while later ones were done using an interactive prototype. Feedback from these tests informed our final design.
Interactive prototype
Karmin put together an interactive prototype in Axure based on our design. This prototype helps demonstrate the tool's interactions, including what actions are and are not allowed. We used this prototype in several of our later usability tests.
Visual design
My final visual wireframes polish up the application.
The interface for asking a question is designed to help people understand how to phrase the question correctly. One common concern people had was that users would accidentally ask a question other than intended, or that they would misinterpret the results. Our final design also gives people a quick snapshot of their result so they can quickly validate the question.


The results page is designed to make it easy to understand the results and to encourage asking follow-up questions to further explore the data. Users can manipulate certain input fields without having to go back to the question interface, and they can break the graphs down by different demographics to see trends more easily.

Other Deliverables
Founding Board Presentation
We were asked to present at the Information School's annual Founding Board meeting. The presentation we put together talks about our project, our process, and our progress as of early May: Founding Board presentation (pdf)
Capstone Presentation Poster
We also created a poster for the capstone poster presentation event:
